

by Anne-Marie Roerink / president, 210 Analytics
The pandemic prompted many changes in meal preparation. Some consumers stressed healthful eating whereas others fell back in more conservative eating patterns. Recipe searches hit new records as shoppers were experimenting with new proteins whether by choice or due to out-of stocks. Throughout all these changes, plant-based meat alternatives continued growth that started long before the onset of the coronavirus pandemic.
Sales growth encompasses frozen and refrigerated plant-based meat alternatives as well as gains in dollars and volume throughout the pandemic. However, it is important to keep in mind that these gains are derived from a relatively small base, a fraction of the size of frozen and fresh meat sales. As such, growth rates are just one part of a bigger story in the red-hot protein market that includes meat, seafood and plant-based meat alternatives.
210 Analytics and IRI partnered to understand the total effect for frozen and fresh meat alternatives since the onset of COVID-19 related grocery shopping patterns in early March.
Plant-based meat alternatives dollar and volume sales growth
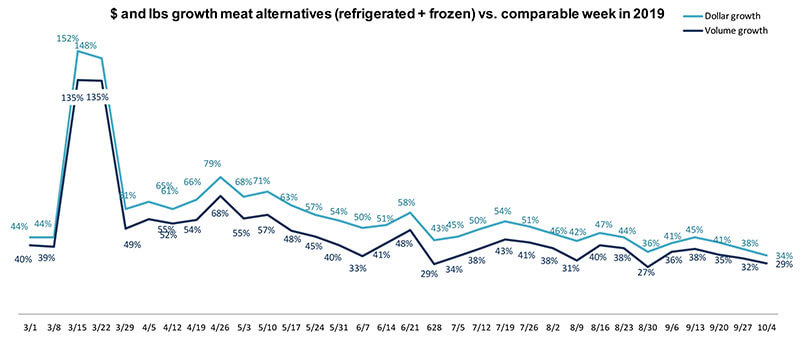
Meat alternative sales (fresh plus frozen) jumped up during the two panic buying weeks in March, along with the rest of the store. Dollar gains peaked at +152 percent and volume at +135 percent versus their 2019 levels. Subsequently, dollar gains have been trending:
- Between +50 percent and +60 percent above year ago for much of April, May and June.
- Between +40 percent and +50 percent ahead of 2019 levels in July and August.
- Between +30 percent and +40 percent in September and the early part of October.
Volume sales growth has trailed dollar gains throughout the pandemic but the gap between the two is narrowing. The week of Oct. 4, volume gains exceeded last year’s levels by 29 percent.
Source: IRI, MULO, 1 week % growth versus year ago
Price
The volume/dollar gap is largely due to inflation. For the week ending Oct. 4, the average price per volume for frozen plant-based meat alternatives was $6.49 versus $7.74 for refrigerated meat alternatives. For comparative purposes, the average price per volume for refrigerated meat this same week was $3.73, with a higher average for beef, at $5.18. Refrigerated plant-based alternatives have seen significant inflation throughout the pandemic of well into the double digits, but unlike meat, prices remained elevated throughout the summer and early fall months. During the March 15 through Oct. 4 pandemic period, the average price per pound for refrigerated meat alternatives was up $0.77 versus the same period year ago.
| Price per volume | w.e. October 4,
2020 |
Pandemic period average | Price increase vs. YA pandemic period |
| Total plant-based meat alternatives | $6.88 | $6.82 | +$0.43 |
| Frozen plant-based meat alternatives | $6.49 | $6.49 | +$0.22 |
| Refrigerated plant-based meat alternatives | $7.74 | $7.53 | +$0.77 |
| Total meat department | $3.73 | $3.83 | +$0.34 |
Source: IRI, MULO, 1 week % growth versus year ago
Frozen versus refrigerated plant-based meat alternatives
Frozen plant-based meat alternatives represent the majority share of total sales, at about 65 percent of total plant-based meat alternative sales. During the week ending Oct. 4, frozen plant-based meat alternatives generated $13.0 million in sales versus $7.0 million for refrigerated plant-based meat alternatives. For comparative purposes, meat generated $1.3 billion in sales this same week.
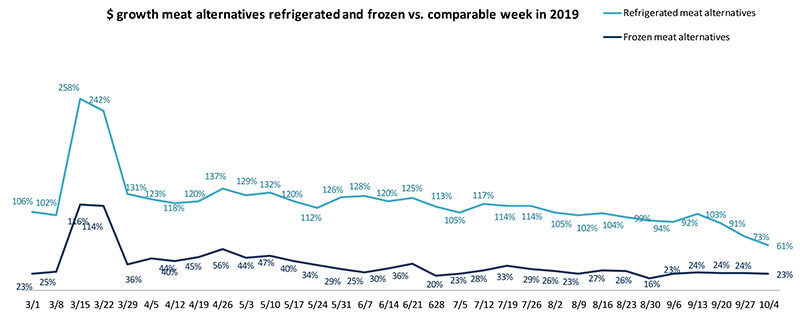
Throughout the pandemic and even before, refrigerated plant-based meat alternatives have outpaced their frozen counterparts in dollar and volume growth. Refrigerated meat alternatives reached a high of +258 percent during the first of the two panic-buying weeks. After many weeks of triple-digit growth, gains have tapered off to +60 percent to +90 percent in more recent weeks. Frozen plant-based alternatives are more established and did not quite see the same high rates generated by fresh. Gains peaked at +116 percent in mid-March and have been very stead between May to October at +20 percent to +30 percent versus year ago.
Source: IRI, MULO, 1 week % growth versus year ago
Converting dollars to shares, 67.9 percent of plant-based meat alternative sales were generated by frozen items the month of March. The remaining 32.1 percent were generated by refrigerated items, typically merchandised in or around the fresh meat case. Given the higher growth rate throughout the pandemic, refrigerated plant-based meat alternatives gained several percentage points in share, reaching a high of 36.2 percent during the month July. Come September, the frozen share of the business stood at 64.4 percent – down 3.5 percentage points from the start of the pandemic.
| $ share meat alternatives | Mar
(3/8-3/29) |
Apr
(4/5-4/26) |
May
(5/3-5/31) |
June
(6/7-6/28) |
July (7/5-7/28) |
Aug (8/3-8/30) | Sep (9/3-10/4) |
| Frozen | 67.9% | 67.8% | 65.9% | 64.7% | 63.8% | 64.8% | 64.4% |
| Refrigerated | 32.1% | 32.2% | 34.1% | 35.3% | 36.2% | 35.2% | 35.6% |
Source: IRI, MULO, share of frozen versus refrigerated plant-based meat alternatives as a percentage of the total
The volume share of refrigerated plant-based meat alternatives is slightly lower than their dollar share, given that refrigerated alternatives average a higher price per volume, as seen earlier. During March, 70.7 percent of volume sales were generated by frozen plant-based meat alternatives. This share was down to 68.2 percent in September, 2020.
| Lbs share meat alternatives | Mar
(3/8-3/29) |
Apr
(4/5-4/26) |
May
(5/3-5/31) |
June
(6/7-6/28) |
July (7/5-7/28) |
Aug (8/3-8/30) |
Sep (9/3-10/4) |
| Frozen | 70.7% | 70.6% | 69.0% | 67.7% | 67.1% | 68.2% | 68.2% |
| Refrigerated | 29.3% | 29.4% | 31.0% | 32.3% | 32.9% | 31.8% | 31.8% |
Source: IRI, MULO, share of frozen versus refrigerated plant-based meat alternatives as a percentage of the total
Meat versus meat alternative sales throughout pandemic
Despite robust sales gains each week, refrigerated meat alternative dollar sales remained a fraction of meat department sales. In September, meat sales totaled $5.2 billion. In comparison, refrigerated plant-based meat alternatives generated $32.2 million and frozen and refrigerated alternatives combined generated $85.5 million.
| $ sales | Mar
(3/8-3/29) |
Apr
(4/5-4/26) |
May
(5/3-5/31) |
June
(6/7-6/28) |
July (7/5-7/28) |
Aug (8/3-8/30) |
Sep (9/3-10/4) |
| Meat dpt | $6.655 billion | $6.261 billion | $7.588 billion | $5.655 billion | $5.733 billion | $5.247 billion |
$5.225 billion |
| Refrigerated plant-based meat alternatives | $34.0 million | $28.1 million | $31.0 million | $31.0 million | $32.3 million | $30.4 million | $32.2 million |
Since the onset of the pandemic-related changes in grocery patterns, the meat department has generated an additional $9.6 billion in sales, versus an additional $127 million for refrigerated plant-based meat alternatives. In volume, an additional 1.6 billion pounds of meat and poultry was sold between March 15 and Oct. 4 compared with 2019 versus an additional 15.2 million pounds of refrigerated plant-based meat alternatives.
| Pandemic period (March 15-August 23) | Dollar growth % | Absolute dollar gains | Volume growth % | Absolute lbs gains |
| Meat department | +28.3% | $9.6 billion | +16.9% | 1.6 billion |
| Refrigerated plant-based meat alternatives | +120.5% | $126.8 million | +97.8% | 15.2 million |
Source: IRI, MULO, dollar and pound growth March 15 through October 4, 2020 versus the comparable period in 2019
Because of these absolute dollar gain differences, the share of refrigerated plant-based meat alternatives as a percentage of the total (meat department sales plus refrigerated plant-based meat alternative sales) actually dipped in March and April. In August and September, the share of sales for refrigerated meat alternatives averaged 0.58 percent. With the volume share unchanged (see below) it is the higher inflationary levels that are driving the slight elevation in share in August and September.
| Share of volume | Mar
(3/8-3/29) |
Apr
(4/5-4/26) |
May
(5/3-5/31) |
June
(6/7-6/28) |
July (7/5-7/28) |
Aug (8/3-8/30) |
Sep (9/3-10/4) |
| Refrigerated plant-based meat alternatives share of total meat + refr. alternative sales | 0.51% | 0.45% | 0.49% | 0.55% | 0.56% | 0.58% | 0.58% |
Source: IRI, MULO, 1 week dollar sales and dollar share
During March, the share of refrigerated plant-based meat alternatives to the total pounds sold for meat plus alternatives stood at 0.26 percent. In the most recent months, the share has held at 0.29 percent
| Share of volume | Mar
(3/8-3/29) |
Apr
(4/5-4/26) |
May
(5/3-5/31) |
June
(6/7-6/28) |
July (7/5-7/28) |
Aug (8/3-8/30) |
Sep (9/3-10/4) |
| Refrigerated plant-based meat alternatives share of total meat + refr. alternative sales | 0.26% | 0.22% | 0.25% | 0.30% | 0.30% | 0.29% | 0.29% |
Source: IRI, MULO, 1 week lbs sales and lbs share
Assortment
While limited supply rocked the fresh meat department throughout May and June, refrigerated meat alternatives have remained consistent in distribution. The tightness in the meat supply caused a drop in the average number of items carried per store. Meat assortment has largely recovered to an average of nearly 328 items come September. During this same month, refrigerated meat alternatives averaged 15.1 items or 4.4 percent of total packages in the case. This means that during September, refrigerated plant-based alternatives represented 4.4 percent of the total number of items, while representing 0.6 percent of dollars and 0.3 percent of volume.
| Average items per store selling | Mar
(3/8-3/29) |
Apr
(4/5-4/26) |
May
(5/3-5/31) |
June
(6/7-6/28) |
July (7/5-7/28) |
Aug (8/3-8/30) |
Sep (9/3-10/4) |
| Meat department | 332.4 | 318.3 | 305.5 | 306.1 | 318.1 | 322.6 | 327.5 |
| Refrigerated plant-based meat alternatives | 15.3 | 14.9 | 14.9 | 15.3 | 15.6 | 15.3 | 15.1 |
| SKU share alternatives | 4.4% | 4.5% | 4.7% | 4.8% | 4.7% | 4.5% | 4.4% |
Source: IRI, Total US, MULO, average weekly items per store selling
What’s next?
Plant-based meat alternative sales have seen tremendous growth throughout the pandemic, even if its overall dollar and volume share is a fraction of meat sales. Dollar and volume gains versus year ago have tapered off significantly in recent months but, even so, remain well above year ago levels.