
by Anne-Marie Roerink / president, 210 Analytics LLC
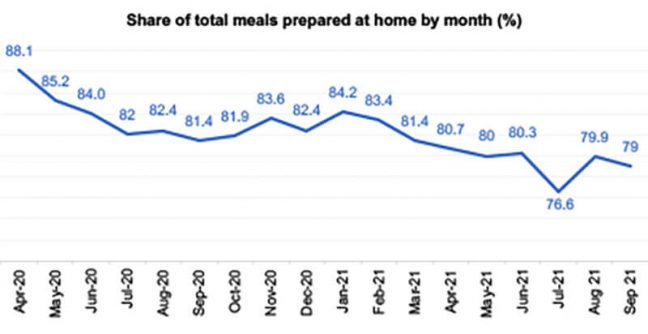 In September, at-home meal preparation remained far above the July low. Nearly 80 percent of total meals were prepared at home, according to the IRI primary shopper survey. Subsequently, some food dollars that had returned to foodservice moved back to retail.
At the same time, the survey found that more people returned to buying groceries online. During the height of the pandemic, as many as 20 percent of trips were online. This dropped to a low of 11 percent in July. In August, the online share of trips increased to 13 percent and in September the share reached 14 percent. An opportunity gap remains for fresh meat when comparing how often center-store and frozen items land in online baskets versus perishables. Produce is leading the way for fresh items, representing 12 out of the top 15 fresh items in household penetration when regarding online baskets within IRI’s household panel. Meat is represented by ground beef and bacon, providing ample room to improve and secure the same share in online and offline baskets across proteins, cuts and brands.
Between the changes in consumer consumption and buying patterns, high inflation and severe supply chain disruption and constraints, meat retailing remains in flux. IRI and 210 Analytics analyzed the retail meat department performance in the first nine months of the year along with a September performance deep dive. The report is made possible by Marriner Marketing.
Inflation
Meat prices, along with food inflation across the store, remained a big topic of discussion in September as prices increased further. The IRI-measured retail price, paid by the shopper, shows continual inflation in the tune of 6% over and above their elevated 2020 levels for total food and beverages in September. Meat prices (dollars divided by volume average at retail) had above-average gains in September amid widespread supply tightness. Across species and cuts, prices were 11 percent higher in September 2021 compared with September 2020.
| Price index vs. YA | 7/4 | 7/11 | 7/18 | 7/25 | 8/1 | 8/8 | 8/15 | 8/22 | 8/29 | 9/5 | 9/12 | 9/19 | 9/26 |
| Total food and beverages | 103 | 104 | 104 | 104 | 104 | 105 | 105 | 106 | 106 | 106 | 106 | 106 | 106 |
| Fresh meat | 100 | 103 | 103 | 105 | 105 | 106 | 107 | 108 | 109 | 111 | 111 | 111 | 111 |
Source: IRI, Integrated Fresh Total US, MULO, inflation index vs. YAGO
The USDA Economic Research Service (ERS) reported last week that Americans spent 7.8 percent less on food in 2020 than the year before as a result of eating more meals at home versus eating out. With food-away-from-home inflation growing even faster than retail inflation, shoppers are continually reminded that home-cooked meals are both less expensive and often healthier. These are important messages for the industry to underscore amid inflation along with subdued promotional activity.
Price per volume
The average price per pound in the meat department, both fixed and random weight, stood at $4.32 in September, up 11.8% from September 2020. Year-to-date, price inflation is more moderate, with an average price of $4.09, up 5.1 percent. Fresh meat has experienced above-average inflation, particularly in recent months. Prices in September were up 13.3 percent over the same month in 2020.
| Price inflation (price/volume) | Price/volume |
Change vs. 2020 |
Change vs. 2019 |
| Total meat September 2021 | $4.32 | +11.8% | +18.6% |
| Total meat YTD through 9/26/2021 | $4.09 | +5.1% | +13.2% |
| Fresh meat September 2021 | $4.15 | +13.3% | +20.8% |
| Fresh meat YTD through 9/26/2021 | $3.95 | +5.2% | +14.7% |
| Processed meat September 2021 | $4.73 | +8.7% | +14.1% |
| Processed meat YTD through 9/26/2021 | $4.41 | +4.8% | +10.0% |
Source: IRI, Integrated Fresh, Total US, MULO, average price per volume and % gain versus YA and 2YA
Meat sales during first three quarters of 2021
Year-to-date meat sales are now between two and three percent behind the record 2020 levels. When compared to the pre-pandemic normal of 2019, sales average between 16 percent and 19 percent above typical levels.
| Meat department —
Year-to-date January through September 2021 |
Dollar sales |
Dollar gains vs. 2020 |
Dollar gains vs. 2019 |
| Total meat department | $60.5B | -2.4% | +17.8% |
| Fresh meat | $40.6B | -2.8% | +18.9% |
| Processed meat | $19.9B | -1.5% | +15.6% |
Source: IRI, Integrated Fresh, Total US, MULO, see end for time period definitions
Importantly, while inflation certainly plays a role, the retail supply chain continues to move more pounds through the system when compared to 2019. Year-to-date, volume sales were down 7.1 percent compared with 2020, but still average 4.1 percent more than in 2019, with above average gains for processed meat, at +5.0 percent.
| Meat department —
Year-to-date January through September 2021 |
Volume (lbs) sales |
Volume gains vs. 2020 |
Volume gains vs. 2019 |
| Total meat department | 14.8B | -7.1% | +4.1% |
| Fresh meat | 10.3B | -7.6% | +3.7% |
| Processed meat | 4.5B | -6.0% | +5.0% |
Source: IRI, Integrated Fresh, Total US, MULO, see end for time period definitions
Meat engagement during first three quarters of 2021
The stellar 2020 meat department performance was secured by better trip conversion and an increase in spend per trip. Year-to-date, engagement is seeing some erosion in all areas, especially trips and spend per trip despite inflation. It is important to keep in mind that at least some shoppers are shifting dollars to the frozen food aisles amid the inflationary conditions, which could account for some of the declines.
- 1% of American households purchased from the meat dept at least once in the first three quarters of 2021. That is down slightly by 0.5 percent from the same period in 2020.
- During January through September, meat department buyers averaged 38.2 product trips, which was down 3.1 percent.
- Shoppers spent an average of $14.38 per trip on refrigerated meat and poultry during the first three quarters of 2021. That was down 0.7 percent% over the same period in 2020 despite inflation of more than 5 percent.
- For the first nine months, shoppers spent a total of $549.51 per buyer, which was down 3.0% over 2020.
Source: IRI, Integrated Fresh household panel, all outlets, total frozen foods YTD through 9/26/2021
Year-to-date sales by region
Year-to-date, sales were highest in the Southeast and Northeast. While all regions lost ground in comparison to 2020, the decreases were minimal for the Mid-South (-0.4 percent). The Plains region had the biggest year-over-year drop, at -6.1 percent.
| Region | Size | Share of total | % increase over YA | |
| Southeast | $9.0B | 16.2% | -2.3% | |
| Northeast | $8.9B | 15.9% | -5.1% | |
| Mid-South | $7.9B | 14.1% | -0.4% | |
| Great Lakes | $7.5B | 13.5% | -2.7% | |
| South Central | $7.3B | 13.1% | -1.7% | |
| West | $6.2B | 11.1% | -2.4% | |
| California | $5.2B | 9.4% | -4.6% | |
| Plains | $3.7B | 6.6% | -6.1% |
Source: IRI, MULO, total frozen, YTD through w.e. 9/5/2021
Week-by-week September sales
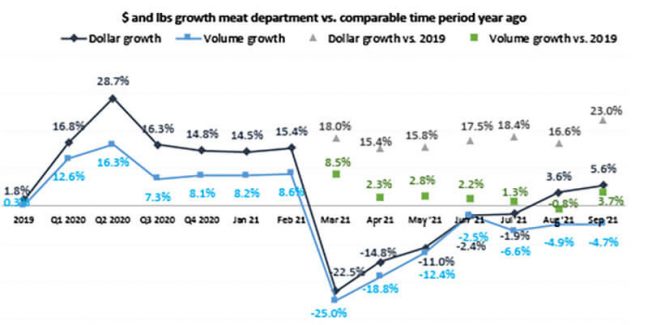
The holiday week, ending Sept. 5, was the biggest of the four September weeks, with sales of $1.7 billion, up 5.8 percent over year ago. Sales dropped slightly in subsequent weeks, but at a minimum of $1.53 billion in the final week of September, meat easily remains the biggest fresh department. Gains over 2019 were around 24 percent above the 2019 levels.
The increase in home-prepared meals pushed volume back over the 2019 pre-pandemic levels. September 2021 pound sales were 3.7 percent above the 2019 levels — the highest increase since March.
| Meat department | Dollar sales | Dollar gains vs. 2020 | Dollar gains vs. 2019 |
| September 2021 | $6.4B | +5.6% | +23.0% |
| w.e. 9/5/2021 | $1.7B | +5.8% | +24.0% |
| w.e. 9/12/2021 | $1.6B | +5.1% | +24.0% |
| w.e. 9/19/2021 | $1.5B | +4.7% | +20.4% |
| w.e. 9/26/2021 | $1.5B | +6.7% | +23.5% |
Source: IRI, Integrated Fresh, Total US, MULO, sales
Source: IRI, Integrated Fresh, MULO, % growth versus year ago
In fresh, volume gains versus 2019 were achieved by beef (+5.7 percent), chicken (+2.0 percent), exotics (+18.5 percent), lamb (+15.7 percent) and pork (+2.6 percent). This is despite supply constraints, SKU reductions and out-of-stocks in many areas. In processed meats, breakfast sausage increased pound sales 12.5 percent over 2019. All other areas within processed meat gained as well, with the one exception of bacon.
Assortment
After many months of reduced assortment in 2020, number of items in the meat department trended up in the second quarter of 2021 only to come back down in the third quarter. In September 2021, the average meat department counted 532 items, which is down to the levels last seen in the third quarter of 2021. Compared with September 2019, the department counts 27 fewer items — a decrease of 4.8 percent. The decrease is fully driven by processed meat that is down 28 items or 7.9 percent.
| Average meat department items per store selling for … | |||||||||
| Q1 20 | Q2 20 | Q3 20 | Q4 20 | Q1 21 | Q2 21 | Q3 21 | Sep 21 | ||
| Items | 560 | 517 | 529 | 546 | 545 | 551.7 | 540.7 | 532.0 | |
| Change | -1.3% | -9.0% | -5.8% | -3.7% | -2.8% | +6.6% | +2.2% | -0.5% | |
Source: IRI, Integrated Fresh, Total US, MULO, average items per store selling
Fresh meat by protein – virtually all protein areas gain
The overall gain in fresh meat sales was supported by beef, chicken, pork, turkey, lamb and exotics. Only veal sales were down slightly versus 2020 levels. Pork and lamb generated the highest gains, with fresh lamb sales still sitting 37.2 percent over year-ago levels.
| September 2021 | $ sales gains versus comparable period year ago | ||||||||||
| Q1 ‘20 | Q2 ‘20 | Q3 ‘20 | Q4 ‘20 | Q1 ‘21 | Q2 ‘21 | Q3 ‘21 | Sep ‘21 | Sep vs ‘20 | Sep vs ‘19 | ||
| Total fresh meat | +16.9% | +32.0% | +18.0% | +15.9% | +0.6% | -10.9% | +2.8% | $4.3B | +6.5% | +24.9% | |
| Fresh beef | +18.0% | +35.7% | +22.6% | +18.6% | +2.2% | -10.7% | +1.9% | $2.4B | +6.1% | +30.5% | |
| Fresh chicken | +13.9% | +23.0% | +10.5% | +13.4% | -1.0% | -9.6% | +4.1% | $1.1B | +6.6% | +16.6% | |
| Fresh pork | +16.5% | +33.6% | +13.9% | +12.3% | -2.3% | -14.6% | +5.0% | $588M | +9.9% | +23.1% | |
| Fresh turkey | +17.2% | +30.4% | +9.1% | +9.5% | -6.8% | -17.3% | +0.7% | $149M | +1.8% | +6.8% | |
| Fresh lamb | +9.4% | +25.3% | +30.5% | +33.6% | +23.4% | +1.6% | +5.8% | $36M | +8.0% | +37.2% | |
| Fresh exotic | +18.6% | +47.6% | +24.4% | +23.2% | +4.1% | -12.7% | +4.0% | $9M | +4.9% | +28.6% | |
| Veal | +0.5% | +16.6% | +15.2% | +12.5% | +5.4% | -2.7% | -2.2% | $4M | -3.0% | +7.3% | |
Source: IRI, Integrated Fresh, MULO, % growth versus year ago
Processed meat – bacon drives impressive growth
Processed meat grew over and above the 2020 and 2019 sales levels, driven by robust bacon, packaged lunchmeat, breakfast sausage and processed chicken sales. Bacon and packaged lunchmeat are the two biggest sellers within processed meat and their gains easily offset the declines seen in hot dogs.
| September 2021 | $ sales gains versus comparable period year ago | |||||||||
| Q1 ‘20 | Q2 ‘20 | Q3 ‘20 | Q4 ‘20 | Q1 ‘21 | Q2 ‘21 | Q3 ‘21 | Sep ‘21 | Sep vs ‘20 | Sep vs ‘19 | |
| Processed meat | +16.6% | +22.5% | +13.0% | +12.8% | +0.3% | -7.1% | +2.6% | $2.1B | +3.7% | +19.2% |
| Bacon | +13.9% | +33.0% | +17.8% | +19.0% | +7.5% | -8.9% | +4.4% | $483M | +6.9% | +27.7% |
| Packaged lunchmeat | +13.3% | +11.4% | +5.4% | +9.8% | -5.1% | -4.4% | +3.8% | $453M | +5.5% | +12.8% |
| Dinner sausage | +21.6% | +32.2% | +15.9% | +13.8% | -3.2% | -13.4% | -0.4% | $357M | +1.8% | +21.5% |
| Frankfurters | +24.0% | +22.5% | +15.8% | +17.1% | -9.9% | -14.6% | -8.2% | $202M | -7.5% | +17.0% |
| Breakfast sausage | +14.3% | +35.8% | +20.0% | +13.6% | +2.3% | -15.0% | +0.4% | $150M | +1.5% | +24.5% |
| Smoked ham | +32.7% | 30.7+% | +17.1% | +3.8% | +1.3% | -23.7% | -3.8% | $61M | +0.7% | +11.6% |
| Processed chicken | +16.7% | +14.2% | +11.2% | +16.8% | +5.8% | +8.4% | +15.0% | $53M | +15.3% | +31.1% |
Source: IRI, Integrated Fresh, Total US, MULO, % change vs. YA
Grinds – renewed growth for ground beef
September built on the positive August results in ground. During the four September weeks, ground beef generated $921 million, up 7.9 percent over year ago and up 21.3 percent versus 2019. Other grinds with year-on-year gains included turkey, chicken and pork. While ground lamb sales are down, supply constraints may be influencing these results.
| % sales change (September 2021) versus year ago | Dollar sales |
Dollar gains vs. 2020 | Dollar gains vs. 2019 |
| Ground beef | $921M | +7.9% | +21.3% |
| Ground turkey | $112M | +3.1% | +8.8% |
| Ground chicken | $17M | +5.8% | +23.0% |
| Ground pork | $14M | +11.2% | +23.5% |
| Ground lamb | $3M | -6.4% | +30.5% |
| Ground veal | $0.9M | -7.4% | +16.4% |
Source: IRI, Integrated Fresh, Total US, MULO, % change vs. YA
What’s next?
A few months ago, nine in 10 Americans expected to celebrate the winter holidays like normal, according to a June survey by 210 Analytics. However, the upswing in COVID-19 case counts in the fall is once more disrupting the Halloween through New Year’s Day holiday celebrations.
A second wave of the study in September found that 51 percent of grocery shoppers now expect COVID-19 to have some level of impact on their plans rather than celebrating like normal. In 2020, the winter holiday gatherings were smaller and home-centric and it is likely that 2021 will see some of the same.
In everyday sales, the 210 Analytics survey also found a renewed focus on finding sales specials, both at the primary store and across stores, likely driven by the combination of inflation and lower promotional levels. In-store promotional signage remained the number one way in which consumers check for specials, but the app overtook the paper circular in the second-most popular way to check promotions.
The next performance report in the IRI, 210 Analytics and Marriner Marketing series will be released mid-November to cover the October sales trends.
Date ranges:
2019: 52 weeks ending 12/28/2019
Q1 2020: 13 weeks ending 3/29/2020
Q2 2020: 13 weeks ending 6/28/2020
Q3 2020: 13 weeks ending 9/27/2020
Q4 2020: 13 weeks ending 12/27/2020
Q1 2021: 13 weeks ending 3/28/2021
Q2 2021: 13 weeks ending 6/27/2021
Q3 2021: 13 weeks ending 9/26/2021
September 2021: 4 weeks ending 9/26/2021