
by Anne-Marie Roerink/President, 210 Analytics LLC
As Memorial Day signals the traditional start of the summer grilling season, meat and poultry often are heavily promoted by grocery retailers across the country. This year, however, tight supply along with price inflation and continued social distancing measures created a very different marketplace and demand.
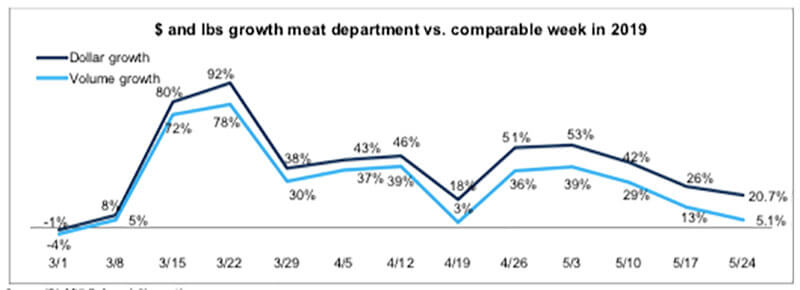
Purchase limits remained in place for many popular cuts, while more states allowed restaurants to re-open dine-in facilities, altering the demand landscape yet again. Despite the supply pressure, dollar sales grew 20.7 percent the week of May 24 versus year ago and volume grew 5.1 percent. The volume/dollar gap widened to 15.6 percentage points.
Source: IRI, MULO, 1 week % growth versus year ago
Year-to-date through May 24, meat department dollar sales were up 24.7 percent, boasting double-digit growth for 11 weeks running. This reflects an additional $5.8 billion sold versus the same time period in 2019. Year-to-date volume sales through May 24 were up 17.3 percent over the same period in 2019, reflecting an additional 1.2 billion pounds of meat and poultry sold versus the same time period in 2019.
Dollar versus volume gains
In point of sale data, the gap between volume and dollar sales was the widest since the onset of coronavirus, at more than 15 percentage points for the week ending May 24—signaling continued pressure on pricing due to tightness in the supply chain.
The longer, four-week look ending May 24 showed continued double-digit volume/dollar gaps for fresh beef and pork, but for other fresh species dollars and volume started to track closer together, including chicken, turkey and exotic meats. Several processed items, including sausage and frankfurters continued to show double-digit volume/dollar gaps also. Bacon, still in ample supply, is one of the few items where dollar gains and volume gains have been tracking very closely together throughout the pandemic.
| Latest 4 weeks ending May 24, 2020 versus comparable weeks in 2019 | Dollar gains | Volume gains | Volume/dollar gap (percentage points) |
| Total meat | +34.9% | +21.0% | -13.9 |
| Fresh beef | +39.3% | +20.4% | -18.9 |
| Ground beef | +37.5% | +14.8% | -22.7 |
| Fresh chicken | +23.8% | +17.8% | -6.0 |
| Fresh pork | +35.2% | +20.2% | -15.0 |
| Fresh turkey | +46.1% | +42.1% | -4.0 |
| Whole Turkey | +181.5% | +152.9% | -28.6 |
| Fresh lamb | +36.6% | +26.7% | -9.9 |
| Fresh exotic | +65.4% | +65.9% | +0.5 |
| Fresh veal | +19.5% | +15.2% | -4.3 |
| Smoked ham/pork | +68.7% | +57.5% | -11.2 |
| Sausage | +37.5% | +26.2% | -11.3 |
| Frankfurters | +21.9% | +4.8% | -17.1 |
| Bacon | +37.5% | +38.3% | +0.8 |
Source: IRI, Total US, MULO, 4 weeks ending May 24, 2020
Supply pressure appears to be lessening some post Memorial Day due to supply issues improving and demand from retail softening a bit.
“U.S. beef production was only 8 percent behind year-ago levels during the holiday-shortened week, while pork production was 6 percent behind last year’s pace,” said Christine McCracken, executive director of food and agribusiness for Rabobank.
That is a significant improvement from her late April reports when beef and pork were at historically low levels, down 35 percent, each.
“Labor availability remains a challenge throughout the industry, forcing some plants to forgo deboning and other value-added activity,” she said. “The chicken industry faced limited disruption this past week with ample labor and plants able to run on Saturdays to maintain production volumes. Chicken supplies will soon tighten however, as production cuts in April and May will begin to limit availability.”
On the demand from food retail and foodservice McCracken commented, “Retail interest following the Memorial Day holiday is softer for many items, with some buyers taking a more cautious approach given uncertain consumer interest. We noted some consumer push back to higher prices on shelf and limited ad activity on beef and pork. We continue to see items on allocation in some chains, however, with production normalizing these product outages have become less frequent. Foodservice demand for most items slowed this week, with pipelines now replenished and consumer demand still slow. Demand for tenders and wings is steady, while ground product interest is also good.
Assortment
Consumer comments on the Retail Feedback Group Constant Customer Feedback system point to purchase restrictions and limited inventory continuing to impact purchases during the week of May 24.
“I did not appreciate your limit of two packs of meat. I needed three steaks and you did not have a three-pack out in the kind of steak I wanted. I was not allowed to buy three individual ones. Dinner ruined. I cannot just buy two if I have three people to feed. Two steaks on a holiday, really?!!!!!!”
Another wrote, “There was lots of chicken, but the red meat case did not have good cuts of roast and steaks.”
IRI’s measure reflecting the average number of items sold per store increased a little to 299.4, but is still far below normal levels. This is the second time the average fell below 300 and reflects 48 fewer items than the same week last year.
| 3/1 | 3/8 | 3/15 | 3/22 | 3/29 | 4/5 | 4/12 | 4/19 | 4/26 | 5/3 | 5/10 | 5/17 | 5/24 | |
| Avg. weekly items/store selling | 334.7 | 334.0 | 353.2 | 329.8 | 307.6 | 318.1 | 318.0 | 313.6 | 309.6 | 309.2 | 302.5 | 296.3 | 299.4 |
Source: IRI, Total US, MULO, average weekly items per store selling
The supply chain woes have affected wholesale and retail prices. Several major consumer media outlets ran articles on supply chain buying and pricing in recent weeks. Shoppers called out higher meat prices and fewer meat features on CCF.
“Your prices are way too high on meat products.” Another shopper said, “The price of meat is terrible. We see on the national news that farmers are being paid less for their beef yet the prices in the store have gone up.”
Retailers are making adjustments in their ads to provide alternate options based on supply and pricing. “For the first time in my over 30-year career, we did not feature top round London Broil on the front page of our ads leading up to Memorial Day as a result of the current situation,” said Samer Rahman, senior director of meat and seafood for Allegiance Retail Services. “We were forced to promote alternative items such as frozen pork baby back ribs, frozen chicken breast and frozen burgers. As a result, frozen meat sales have seen double digit growth in the last few weeks.”
IRI’s insights on the average retail price per volume show significant upward pressure on retail prices for the week ending May 24 versus the same week in 2019 for beef, particularly ground beef, and pork. However, compared to the week prior, prices only increased slightly, at +0.6 percent. The average price per volume for chicken and pork actually decreased from the week prior. McCracken believes that the balance of supply and demand may soon be bringing some price relief.
“With retail and foodservice buyers cautious on consumer buying patterns and production gradually improving, we would not be surprised to see prices move lower in the coming week. This could provide a more attractive price point for many items over the upcoming Father’s Day holiday,” she said.
| Average price per volume versus the same period year ago |
1 week ending May 24 | 4 weeks ending May 24 | |||
| Average | Change vs. prior period | Change vs. YA |
Average | Change vs. year ago | |
| Total meat | $3.94 | +0.6% | +14.9% | $3.89 | +12.1% |
| Fresh beef | $6.13 | +4.7% | +26.1% | $5.73 | +17.2% |
| Ground beef | $4.84 | +4.9% | +32.3% | $4.50 | +21.4% |
| Fresh chicken | $2.40 | -1.8% | +6.7% | $2.44 | +5.3% |
| Fresh pork | $3.05 | -2.6% | +16.5% | $2.99 | +12.9% |
| Fresh turkey | $3.38 | +1.8% | +2.7% | $3.34 | +2.9% |
| Fresh lamb | $8.42 | +5.7% | +5.8% | $8.37 | +8.0% |
| Fresh exotic | $4.29 | +3.0% | -0.1% | $4.19 | +1.5% |
Source: IRI, Total US, MULO, 1 week and 4 weeks ending May 24, 2020
Meat Gains by Protein
The overall 20.7 percent meat department gain was fueled by double-digit gains for all proteins. The two smaller proteins, turkey (+33.7 percent) and lamb (+44.3 percent), had the highest percentage gains, but beef easily had the highest absolute dollar gains (+$104 million), followed by chicken (+$36 million) and pork (+$36 million).
Turkey’s strong week was driven by the combination of growth in ground turkey (+31.7 percent) and whole turkeys (+95.0 percent). The latter is driven by extended holiday promotions by several retailers and particularly Walmart’s “pay it forward,” no expiration gift card that can be used specifically towards a whole bird turkey or ham.
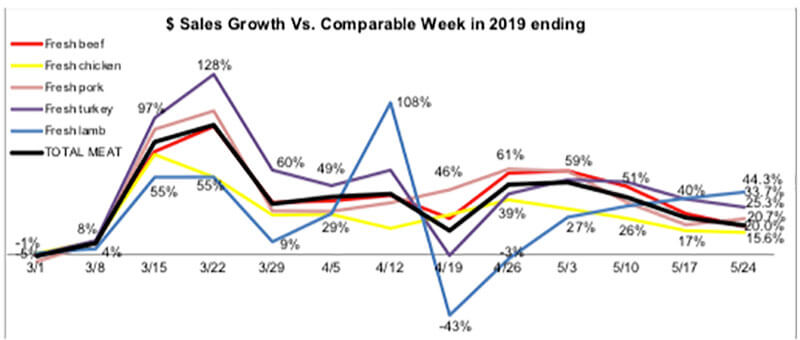
Source: IRI, Total US, MULO, 1 week % change vs. YA
Grinds
Ground proteins were frequently among those items with purchase limitations in mid-March and again in late April and May. Popular due to their versatility and ease of preparation, grinds achieved big gains over the week ending May 24 versus the comparable week in 2019:
- Ground beef increased 17.5 percent, its lowest year-over-year increase since the week ending March 1;
- Ground turkey, +31.7 percent;
- Ground chicken, +24.3 percent; and
- Ground pork, +29.3 percent.
Ground beef has been a pandemic powerhouse. For the week ending May 24 versus year ago, these four ground proteins generated an additional $45 million. Year to date, these four have sold an additional $1.3 billion versus the same period in 2019.
A detailed look by area
Total meat department sales came in just over $1.5 billion for the week, with continued gains for the big three (beef, chicken and pork) that have seen double and triple-digit increases ever since the week of March 15. Processed meats, sausages, frankfurters and bacon continued to do extremely well also.
| 2020 Weekly $ sales gains versus comparable 2019 week ending… | $ | |||||||
| 3/1 | March (w.e. 3/8-3-29) |
April (w.e. 4/5-4/26) |
5/3 | 5/10 | 5/17 | 5/24 | 5/24 | |
| TOTAL MEAT | -1% | +53.9% | +38.3% | +53% | +42% | +26% | +20.7% | $1.5B |
| Fresh | ||||||||
| Beef | 0% | +53.0% | +41.6% | +61% | +49% | +30% | +20.0% | $624M |
| Chicken | +1% | +41.0% | +31.6% | +35% | +28% | +17% | +15.6% | $268M |
| Pork | -5% | +56.2% | +43.5% | +59% | +37% | +21% | +25.3% | $178M |
| Turkey | 0% | +72.1% | +36.0% | +55% | +53% | +41% | +33.7% | $44M |
| Lamb | +1% | +33.6% | +8.4% | +28% | +36% | +40% | +44.3% | $10M |
| Exotic | +5% | +91.6% | +53.8% | +75% | +71% | +62% | +52.4% | $3M |
| Processed | ||||||||
| Smoked ham/pork | -6% | +118.2% | +20.1% | +103% | +85% | +44% | +38.7% | $17M |
| Sausage | 0% | +63.3% | +41.8% | +51% | +41% | +35% | +26.0% | $154M |
| Frankfurters | -1% | +76.0% | +38.8% | +36% | +31% | +20% | +8.4% | $84M |
| Bacon | -6% | +53.7% | +47.9% | +59% | +40% | +28% | +25.2% | $120M |
Source: IRI, Total US, MULO, 1 week % change vs. YA
Market shifts
Significant differences are observed when comparing dollar protein shares between the first week of March, reflecting pre-pandemic sales levels, and the week ending May 24. While shares are influenced by holidays and differ from week to week, pork and beef’s dollar share continues to be elevated in the one week and year-to-date views, whereas chicken’s share is down in both. The same look at volume shows the effect of pricing, with pork making up a significantly larger share in volume, but beef and chicken down. Beef shares had been tracking ahead, but supply chain tightness pressured the volume share the week of May 24.
| Dollar sales | Volume sales | |||||
| Week ending 3/1/20 | Week ending 5/24/20 | Building calendar year 2019 | Building calendar year 2020 | Week ending 3/1/20 | Week ending 5/24/20 | |
| Beef | 53.3% | 55.3% | 54.6% | 55.1% | 37.0% | 35.5% |
| Chicken | 27.5% | 23.8% | 26.4% | 25.7% | 40.5% | 38.9% |
| Pork | 12.9% | 15.7% | 13.3% | 13.4% | 16.5% | 20.3% |
| Turkey | 4.4% | 3.9% | 4.3% | 4.5% | 4.8% | 4.6% |
| Lamb | 0.9% | 0.9% | 1.1% | 0.9% | 0.4% | 0.4% |
| Veal | 0.1% | 0.1% | 0.1% | 0.1% | 0.1% | 0.1% |
| Exotic | 0.3% | 0.3% | 0.3% | 0.3% | 0.2% | 0.2% |
Source: IRI, Total US, MULO, % of total fresh dollars | “All other” not reflected
What’s next?
The next sales report, covering week 12 of coronavirus’ affected shopping patterns, is the final week of May. For some states, that coincided with the start of summer vacation. Since mid-March, the closing of schools and colleges brought many more meal occasions to at-home. Now, the altered COVID-19 consumption patterns will go up against summer vacation will go up against summer vacation consumption patterns of prior years.
Meanwhile, the relaxation of the stay-at-home executive orders looks different from state to state. Many have relaxed mandates allowing some consumers to shop, dine and work out of home. The economic recovery along with the foodservice engagement in those states will be very telling for the likely level of demand at food retailing for the foreseeable future. Given the limited seating, economic pressure and perhaps some latent social anxiety, it is likely that grocery demand will continue to sit well above the 2019 baseline, with meat in a starring role.
210 Analytics and IRI will provide sales updates weekly.